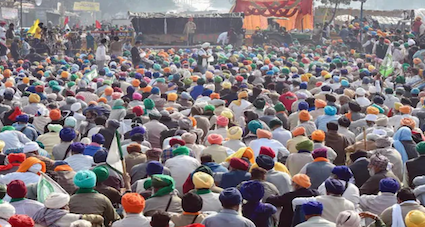
A hindi newspaper Dainik Jagran has pursued the “Kumbh Mela-as-super-spreader” theory and having spoken to authorities and collating it with data, it has come to following conclusions:
- On March 11, on Mahashivratri festival, no less than 32.37 lakh took a dip in Haridwar. Twenty days later, on March 31, the total number of Covid-19 positive case in the state was only 293. Haridwar? Only 70.
- It was claimed that on the days of Mahashivratri and 3 Shahi Snans (April 12, 14, 27), some 65-70 lakhs faithfuls had descended in Haridwar. The investigation by the daily, by comparing the arrival of visitors—through tickets sold for rail and buses, as well as occupancy in accommodation—reveals that on Mahashivratri, by public transport some 33,200 visitors came to Haridwar and on four Shahi Snans, the figure was 92, 700. The personal vehicles were no more than 5 lakhs. Even if one includes Sadhu Wants (another 5 lakhs), it’s far less than the total projected in media.
- The president of the hotel association in Haridwar, Ashutosh Sharma says some 20-30% occupant in hotel, lodge, resort or guest houses etc were vacant. The Senior Superintendent of Police, Sanjay Gunjal, as per the newspaper, said only some 15,000 police personnel were posted (145 of them have tested positive).
- The positivity rate in Uttarakhand, in March-April was only 0.34 per cent. In Haridwar? 0.15 per cent.
- In the last Shahi Snan, the positivity rate in Uttarakhand was 15.05. In Haridwar it was 6.2 percent—still it was called the hotspot.
- Further, the details of faithfuls reveal that three states where the 2nd Wave of pandemic wreaked maximum havoc, made least representation in the Kumbh Mela.
Then who caused the spread of 2nd Wave of Covid-19 pandemic in India?
The data reveals that the 2nd Wave began in Punjab in early January 2021. It was in step with the protesting farmers’ agitation, and on back of a lethal UK-variant of the Wuhan virus.
Testing in Punjab declined consistently from December 2020 to early February 2021. The report in Swarajyamag presents charts to buttress its claim in key Punjab cities such as Jalandhar, Ludhiana and Amritsar.
From there, the spread to Haryana was logical and the data supports such a claim. Gurugram began showing a spike from January 6 onwards; Faridabad too began rising steadily with Covid-19 patients from January 3 onwards. The two adjoining districts of Karnal and Kurukshetra in Haryana, which fall on the road from Punjab to Delhi, also began shooting up with infected patients.
Indeed, in Haryana the testing dropped by 75 percent between December 25. 2020 and February 1, 2021.
From there on, a spread to Delhi was only logical.
The data is as conclusive as it gets that the origins of the 2nd Wave was through the farmers’ protest, a full month before lethal clusters began ravaging Maharashtra.
It didn’t help that people came in droves from the United Kingdom to Punjab in early January 2021.
It’s important that the data is taken note of by the Centre and publicized, as well as for Indian Courts to call upon required measures so that the 3rd Wave, if and when it hits, is contained without much damage.
As a postscript, one wonders whether the Arvind Kejriwal government in Delhi looked at this data or ignored it. For it’s known that he made 14-day quarantine for visitors from Kumbh Mela mandatory even while egging on the protesting farmers, holding a few meetings of theirs on his own, which the data points finger at as the possible spreader of Coronavirus in its second wave.


