
Before budget session of 2022, spaces in Indian mainstream media are talking about income reduction of the poorest segment by 53%. This is based on sub-segmentation of bottom 50% population’s income data.
While accuracy of this information depends on precision of sub-segmentation & honesty of representation, the most striking fact presented by the World Inequality Report 2022 is the deprivation of middle 40% of India’s population of their due income share.
Indian middle 40% is lagging far behind in income share not only with respect to world data and the top 10 global economies in which India ranks 6th, but also with respect to all her close neighbours like China, Bangladesh, Sri Lanka, Nepal & Pakistan.
Even if it is assumed that income sub-segmentation of poorest 50% has not been done inaccurately, the niche segment to focus upon in order to even out income disparity between top 10%, middle 40% & the bottom 50% is the mid segment. I wish to elucidate how middle 40% is the most crucial part of any economy & how success of poverty alleviation programs taken up by Government of India are being compromised due to a deprived middle class.
However, before coming to a discussion on key points about economic inequality & sharing my humble opinion about where to target to achieve a sustainably even distribution of wealth & income, stating the lacunae in Oxfam’s inequality report generated in January this year is necessary. While there is little doubt that Oxfam’s methodology to generate report is unsound and fallacious, existence of economic inequality is a reality not only in India but all over the globe.
After being an independent affiliate Indian NGO in 2008, Oxfam was registered by Government of India as a non-profit organization under Section 8 of the Indian Companies Act, 2013 and acquired a Foreign Contribution Regulation Act (FCRA) license. However, Oxfam could not renew their FCRA approval from Government of India this year having their FCRA license expired on December 31, 2021.
While Oxfam India calls themselves a movement to end discrimination, the organization has been consistently discriminating against the truth of India by indulging in seemingly premeditated representation of data keeping study sample sizes unusually small to represent Indian population. In last few years Oxfam generated reports on issues like hunger index, economic inequality etc. all of which were statistically misleading for wrong sampling and methodology.
Wealth Computation Approach: Not Quite Indian
While Oxfam puts India’s wealthiest 10 % account for 45% of national wealth and bottom 50% for just 6%, the figures given by World Inequality Report 2022 is different. As per World Inequality Report 2022, the top 10 percent of India’s population have captured 64% of India’s wealth while the bottom half of the population owns only 5.9 ≈ 6%. Comparing this with global figures, disparities in global wealth are more striking with the top 10% having owned 76% of global wealth leaving the bottom 50% with barely 2%.
On December 12 2020, the RSS chief Mohan Bhagwat met a group of accomplished men and women in Kolkata where he was asked about his opinion regarding such an inequality report of last year. Bhagwat put forth a point which Thomas Piketty et al may take a note of. The concept of wealth in India and that elsewhere in the globe may differ. As Bhagwat mentioned, grandparents of innumerable common poor households of India whose general spending capacity is less often have ample wealth saved in pots or in steel trunks etc. in the house itself which neither add to day-to-day affluence of the family, nor get counted to compute wealth index. These sums could be counted as ‘wealth’ in an Indian version of Inequality Study. Bhagwat indicated necessity of an Indian Study to measure economic inequality in India. World Inequality Report has taken household wealth to be the sum of all financial assets (e.g. stock, bonds) and non-financial assets (e.g. housing), net of debts. In addition to these, amount of gold possessed by common Indian populace also needs to be included in wealth computation which, however, may make the wealth scenario look different. Such reasons exist why many people rejected the wealth picture portrayed by Inequality Reports.
Inherent Fallacy in Approach to Portray Income Inequality
In World Inequality Report 2022 as well as in Oxfam’s, the level of income inequality has been measured as the ratio between average income of the richest 10% population and that of the poorest 50%. It is thus expressed as the number of times top 10% earn as compared to the bottom 50%. This approach to portray income inequality, however, appears biased and contains an inherent fallacy. This approach deliberately ignores the average income of middle 40% of the population, which, in fact, frame the backbone of any economy. It is absolutely necessary not to ignore the income share of middle 40% to map the true picture of inequality in a country.
Pradhan Mantri Garib Kalyan Anna Yojana provided food grains to 80 crore Indians which constitutes approximately 55 – 60% of population. This means around 82% of middle 40% remained deprived of PMGKAY. Similarly, all other Government aids catered to the bottom 55% of Indian populace leaving the largest segment of middle 40% dry. As man’s ability to consume is limited, top 10% consumes up to the ceiling of its potential & reaches the segment’s consumption-saturation point. However, empowering middle 40% with additional income is supposed to mobilize the economy faster as middle 40% consumes much lesser than the segment’s potential. Upon availability of additional income, hence, middle 40% would consume more letting money flow down the strata underneath. Because the middle class lives nowhere near their consumption-saturation point, money percolates down fastest & most uniformly from this segment of the economy. To be fair, middle 40% needs to have at least 40% share of national income while almost all countries follow this thumb rule except India (and a very few others). For good health of the economy, middle 40% needs to have a bit more than 40% income share as it can be mathematically elucidated how overall inequality can be altered depending on middle 40%’s income share.
Case 1
Suppose the income distribution of a particular country of 100 million population be such that the average income of top 10% of it is $50000 whereas that of the bottom 50% is $5000. In this case, inequality ratio between top 10% & bottom 50% would be shown as 10:1 (as per the process adopted by World Inequality Report, Oxfam etc.). However, this would not render the true inequality scenario of that country as this is not rendering the total gross income volume of it. As a result, finding out the share of gross income enjoyed by the top 10% as compared to the bottom 50% is also not possible. This remains undetermined due to lack of income data of middle 40% of that country which can vary freely between the wide range of $5000 and $50000.
Case 2
Now, if the average income of this middle 40% population be $10000, then the gross total income of the country will be as follows:
{(10 million × $50000) + (40 million × $10000) + (50 million × $5000)}
= $500 billion + $400 billion + $250 billion
=$1150 billion
In this case, the income share of top 10% will be 43.48% ($500 billion out of a total of $1150 billion) of the gross total income of the country while that of bottom 50% will be 21.74% ($250 billion out of a total of $1150 billion).
Case 3
But, if the average income of this middle 40% population be $40000 instead of $10000, as stated in Case 2, then the gross total income of the country will be as follows:
{(10 million × $50000) + (40 million × $40000) + (50 million × $5000)}
=$500 billion + $1600 billion + $250 billion
=$2350 billion
In this case, the income share of top 10% will be 21.28% ($500 billion out of a total of $2350 billion) of the gross total income of the country which is less than even half as portrayed in Case 2 (where their share was calculated to be 43.48%). This implies, inequality is much less in Case 3 where middle 40% income share was greater than in Case 2. Hence, over and above considering the income share of top 10% and bottom 50% of any country, it’s absolutely necessary to also consider the income share of middle 40% in order to get the true picture of the country’s inequality status.
Indian Middle Class is Deprived of Legitimate Income Share
Income scenario as given by World Inequality Report, however, shows a striking feature. While global wealth index computation didn’t count wealth as per Indian concept, income distribution across different strata of the society (as shown in World Inequality Report) is quite revealing and comprehensive. Even after considering data inaccuracies to some extent, overall trend of income distribution suggests something not-so-good. In comparison to the whole world as well as to other countries, middle income group in India is extraordinarily deprived of the segment’s legitimate share of income. It is evident from the data & certain basic derivatives thereof that as in all other countries, the top 10% of India is snatching income shares from the middle 40% & the bottom 50%. However, in India, proportionate hijacking of income share from the middle 40% is more pronounced than that from bottom 50%. In order to consider the extent of income inequality in India with respect to other countries, it’s necessary to first compare India with some of her neighbouring countries having similar socio-cultural norms followed by comparison of India with the other nine largest economies of the world as per Nominal GDP (India ranking 6th) and finally with the World average as given in the World Inequality Report 2022.
Adhering to the data as reflected in the World Inequality Report 2022 regarding income share of bottom 50%, middle 40% and top 10% of each country in terms of percentage of corresponding national income, pictures of India and her neighbouring countries are as follows:
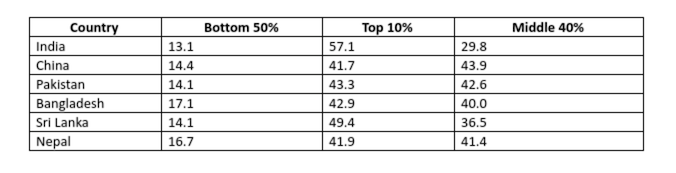
Amongst all countries considered, inequality is most striking in India as bottom 50% here earn the least share of corresponding national income whereas top 10% earn the highest share. That’s something which perhaps everyone would observe. However, there’s another take from the above data table which shows Indian middle class, similar to the Indian poor (or rather, up to a strikingly greater extent), do also lag far behind the middle class of other countries under consideration. Now, though it’s statistically incorrect to consider the average income share of the countries under consideration to be simply the arithmetic mean of individual income shares (without considering the individual population of each country, the exact value of Gross National Income of each country etc.), the following table is drawn to have an approximate impression about the extent of deviation different sections of Indian society experience with respect to their counterparts from other countries.
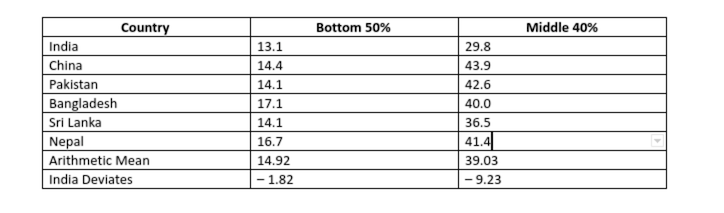
While income share of bottom 50% of India lags behind the income shares of corresponding sections of neighbouring countries by about 2%, that of middle 40% of India lags behind by 10%. This may be because Governmental Garib Kalyan Yojnas provide support to bottom 50% protecting them up to a considerable extent against income hijacking. In absence of any Governmental support for middle 40% (in terms of direct benefit transfer or significant tax relief), income hijack from them is more pronounced. However, while Government Garib Kalyan Yojnas prevented worse ‘garibi’ for bottom 50%, Government effectively derived money for such cause from the middle 40%.
Comparative scenario of the extent and nature of inequality in India with respect to the 10 largest global economies (of which India is one) and finally with the World average (as given in World Inequality Report 2022) is as follows:
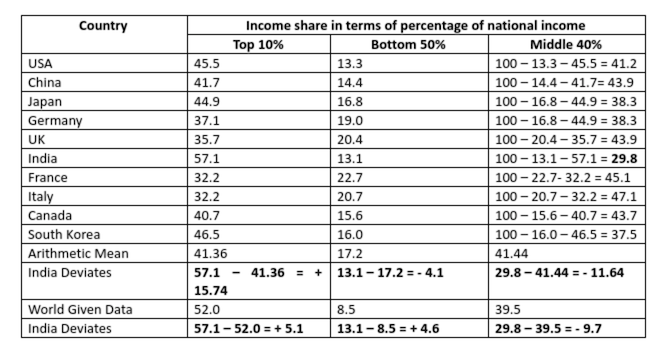
While inequality is most striking in India, Indian middle 40% lags maximum behind those of other countries under consideration and the whole world. While share of India’s national income earned by India’s bottom 50% is 4% greater than the share earned by bottom 50% of the global population from global income, share of India’s national income earned by India’s middle 40% is 10% lesser than the share earned by middle 40% of the global population from global income. In comparison to the income share of middle 40% of other 9 largest global economies, India’s middle 40% earns around 12% lesser while in comparison to the income share of bottom 50% of other 9 largest global economies, India’s bottom 50% earns around 4% lesser.
Mechanism of Deprivation
Middle 40% suffers by several mechanisms. As money poured in to the bottom 50% in terms of Garib Kalyan Yojnas, their access to available resources increased raising demand for those resources resulting in subsequent price rise making them comparatively unaffordable to a considerably large section of the middle 40%. A number of resources earlier affordable by middle 40% became unaffordable to them making a large section of middle 40% poorer with respect to market price. As middle 40% didn’t receive Government support, their financial ability to afford those resources got compromised. Had middle 40% too got proportionate replenishment from top 10% in terms of additional employment and/or tax relief by the Government, inequality picture could have remained sustainable for all.
In India for all practical purposes, poverty alleviation is being attempted at the cost of middle 40%. Moreover, rise in demand due to bottom 50%’s increased access to resources didn’t yield a sustained demand growth. This is because affording capacity of a significantly large section of middle 40% (who were existing consumers of those resources during pre-pandemic time) reduced. However, final stagnation of demand didn’t result in subsequent price reduction (taking the price back to the level where it was before temporary rise in demand). As a result, purchase power of the lower stratum of middle 40% turned lesser than their own purchase power earlier. Reduction of purchase power of a significantly large section of the middle 40% is the cause why steady growth in demand could not be achieved.
Garib Kalyan Yojnas of the Government of India could not yield poverty alleviation to the extent they should have. While the pre-pandemic uppermost stratum of the bottom 50% rose up to the lower most stratum of the middle 40% with the help of Government support, pre-pandemic lower-most stratum of the middle 40% slipped silently down without being noticed into the uppermost stratum of the bottom 50% keeping the whole picture constant. While some particular people got rid of the bottom 50% tag, some middle 40% people acquired it resulting in overall retardation of Garib Kalyan Yojnas’ success.
As the middle-income group makes up the value system of a society, it’s not wrong to mark this stratum as the soul thereof. The middle 40% stratum being most expressive, a deprived middle 40% may indirectly help setting in anarchy. While middle class remained the strongest support base of NDA, they suffered the maximum in India in comparison to almost all other countries. Is this one of the reasons behind too much of protest being heard against the present Government? A sound middle income group has capacity to rebut & negate illogical protest arguments. However, if they don’t feel as affluent as they felt earlier, would they have scope and/or feel the drive to do so?
Budget Needs to Favour Indian Middle Class for Growth
While it is impossible for the Government to comprehensively remove bottom 50%’s poverty only by distributing doles (without ensuring good educational facilities & good policies for psychological development of the mass) because that would require an astronomical sum, it requires a little good intention & wisdom of the Government to improve spending capacity of middle 40%. The first thing in that direction may be placing a budget favourable for the middle 40% this year.
At present, Government kept 5 lacs pa income tax free for those who earn up to 5 lacs. Government may make income up to 5 lacs pa tax free for all. People earning more than 5 lacs may be taxed upon their income over and above 5 lacs
At present, standard deduction of 50 thousand is allowed for salaried individuals opting to pay income tax as per old income tax scheme. Government may allow the same standard deduction for all salaried individuals irrespective of whether they choose to pay income tax as per old or new scheme
Government may abolish the old tax scheme and make the tax slabs of the new tax scheme applicable for all allowing them to take all applicable deductions
Government may make income up to Rs. 7.5 lacs pa tax free for all. People earning more than 7.5 lacs may be taxed upon their income over and above 7.5 lacs. The resultant collection deficit may be replenished by the Government by slightly increasing the corporate tax. While this would offer substantial tax benefit to income tax payers, slight increase in corporate tax would not make it difficult for corporate tax payers either.
Findings of Mood of The Nation 22 survey conducted by a media house found 71% people described unemployment situation being serious with 65% saying their financial condition worsened or remained same since 2014. Reduction of overall domestic income too came out to be an alarming finding of the said survey. All these being in predictable congruence with a deprived middle 40% economy, the solution depends on the vision of the Government.
Debjani Bhattacharyya is a columnist who’s a keen observer of politics and social changes.. A communication-strategist by profession having special aptitude for analytical jackknifing of information, Debjani is a Pharmaceutical Engineer & a Management Professional by her credentials.
Analysis of data & information for generating insights for policy planning is a passion while her other significant area of interest is the Constitution of India and its interpretations thereof. She’s a voracious reader with enormous affinity towards Classics of Bengali Literature. She is an opinion-maker on social media through her blog, twitter and facebook.